icinga2 influxdb grafana integration
Using influxdb as storage, icinga2 passing the performance data which returned by plugins, and grafana is used for data visulizing.
preparation
plugins’ output is STRICTLY nagios standard output
# OK - load average: 0.69, 0.97, 0.94|load1=0.690;16.000;30.000;0; load5=0.970;20.000;32.000;0; load15=0.940;24.000;34.000;0; # hosts icinga2.server1.host.hostalive.perfdata.pl.value 0 1449566712 icinga2.server1.host.hostalive.perfdata.rta.value 0.0041609999999999998 1449566712 # services icinga2.server1.service.nrpe_load.perfdata.load1.value 0.01 1449567314 icinga2.server1.service.nrpe_load.perfdata.load5.value 0 1449567314 icinga2.server1.service.nrpe_load.perfdata.load15.value 0 1449567314
|
enable icinga2 graphite feature
# icinga2 feature enable perfdata
# icinga2 feature enable graphite
# vim /etc/icinga2/features-enabled/graphite.conf
* The GraphiteWriter type writes check result metrics and * performance data to a graphite tcp socket. */ library "perfdata" object GraphiteWriter "graphite" { host = "influxdb-server-with-graphite-plugin" port = 2004 host_name_template = "icinga2.$host.name$.host.$host.check_command$" service_name_template = "icinga2.$host.name$.service.$service.name$" }
|
define the internal link, guiding to grafana dashboard
# vim /etc/icinga2/conf.d/templates.conf
template Service "grafana-svc" { notes_url = "http://grafana.yourdomain.com/dashboard/db/icinga?var-HOST=$HOSTNAME$&var-CMD=$SERVICEDESC$" }
|
apply the template
# vim /etc/icinga2/conf.d/services.conf
apply Service "nrpe_ss" { import "generic-service" import "grafana-svc" check_command = "nrpe" assign where "webserver" in host.groups vars.nrpe_timeout = 240 vars.nrpe_command = "check_ss" }
|
icinga2 daemon -C && service icinga2 reload
Influxdb graphite plugin configuration
# vim /etc/influxdb/influxdb.conf
[[graphite]] enabled = true database = "icinga" bind-address = ":2004" protocol = "tcp" consistency-level = "one" ignore-unnamed = true name-separator = "|" # name-separator = "_" templates = [ "icinga2.*.host.*.perfdata.*.* .measurement..cmd..metric.value", "icinga2.*.service.*.perfdata.*.* .measurement..cmd..metric.value", ] [[graphite]] enabled = true database = "graphite" bind-address = ":2003" protocol = "tcp" consistency-level = "one" # name-separator = ";" name-separator = "." # These next lines control how batching works. You should have this enabled # otherwise you could get dropped metrics or poor performance. Batching # will buffer points in memory if you have many coming in. # batch-size = 1000 # will flush if this many points get buffered # batch-pending = 5 # number of batches that may be pending in memory # batch-timeout = "1s" # will flush at least this often even if we haven't hit buffer limit # udp-read-buffer = 0 # UDP Read buffer size, 0 means OS default. UDP listener will fail if set above OS max. ## "name-schema" configures tag names for parsing the metric name from graphite protocol; ## separated by `name-separator`. ## The "measurement" tag is special and the corresponding field will become ## the name of the metric. ## e.g. "type.host.measurement.device" will parse "server.localhost.cpu.cpu0" as ## { ## measurement: "cpu", ## tags: { ## "type": "server", ## "host": "localhost, ## "device": "cpu0" ## } ## } # name-schema = "type.host.measurement.device" ## If set to true, when the input metric name has more fields than `name-schema` specified, ## the extra fields will be ignored. ## Otherwise an error will be logged and the metric rejected. # ignore-unnamed = true ### ### [collectd] ### ### Controls the listener for collectd data. ###
|
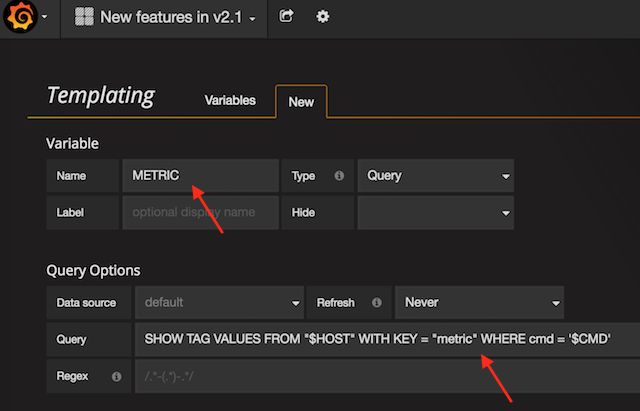
# grafana template variables $HOST SHOW MEASUREMENTS $CMD SHOW TAG VALUES FROM "$HOST" WITH KEY = "cmd" $METRIC SHOW TAG VALUES FROM "$HOST" WITH KEY = "metric" WHERE cmd = '$CMD'
|
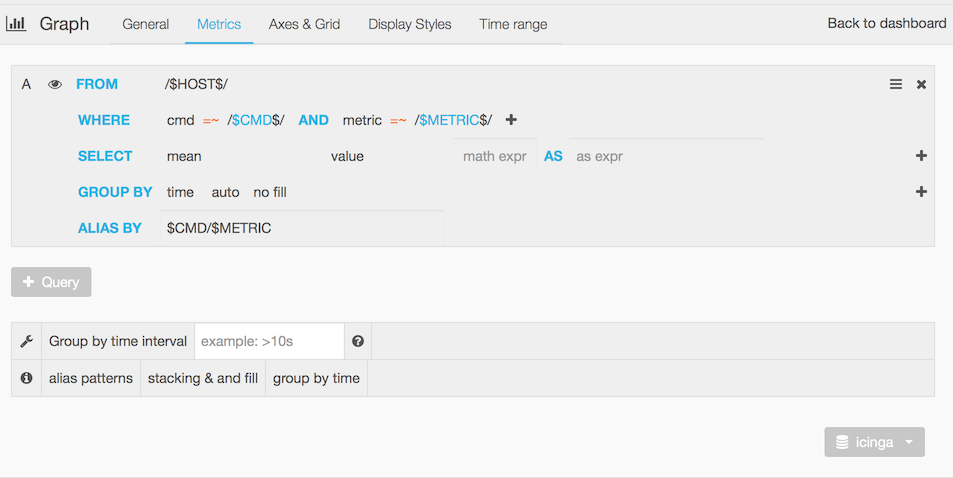
grafana query below
Get the share link from grafana dashboard
<iframe src="http://grafana.yourdomain.com/dashboard-solo/db/icinga?panelId=1&fullscreen&var-HOST=server1&var-CMD=nrpe_ss" width="450" height="200" frameborder="0"></iframe>
|
cd /etc/icingaweb2/enabledModules/pnp4nagios/
icingaweb2 modules API here
/usr/share/icingaweb2/modules/monitoring/library/Monitoring/Object/Service.php
add grafana integration into icingaweb2
/usr/share/icingaweb2/modules/pnp4nagios/library/Pnp4nagios/Grapher.php
class Grapher extends GrapherHook { .........OLD COLD BLOCK........ protected $baseUrl = '/pnp4nagios'; protected $grafanaBaseUrl = 'http://yourdomain.com/dashboard-solo/db/icinga?panelId=1&fullscreen'; .........OLD COLD BLOCK........ public function getPreviewHtml(MonitoredObject $object) { .........OLD COLD BLOCK........ $html .= " </tr>\n <tr>\n"; foreach ($viewKeys as $view) { $html .= ' <td style="border-left: 1px solid #555; padding-right: 3px">' . $this->getPreviewImg($host, $service, $view) . "</td>\n"; } if ($service != '_HOST_' && $object->service_notes_url) { $html .= "<tr>\n <td>\n"; $grafanaIframe = sprintf( '<iframe src="%s&var-HOST=%s&var-CMD=%s" width="480" height="150" frameborder="0"></iframe>', $this->grafanaBaseUrl, $host, $service); $html .= $grafanaIframe; $html .= "</td>\n </tr>\n"; } $html .= "</tr></table>\n"; return $html; }
|
demos
work aside pnp4nagios
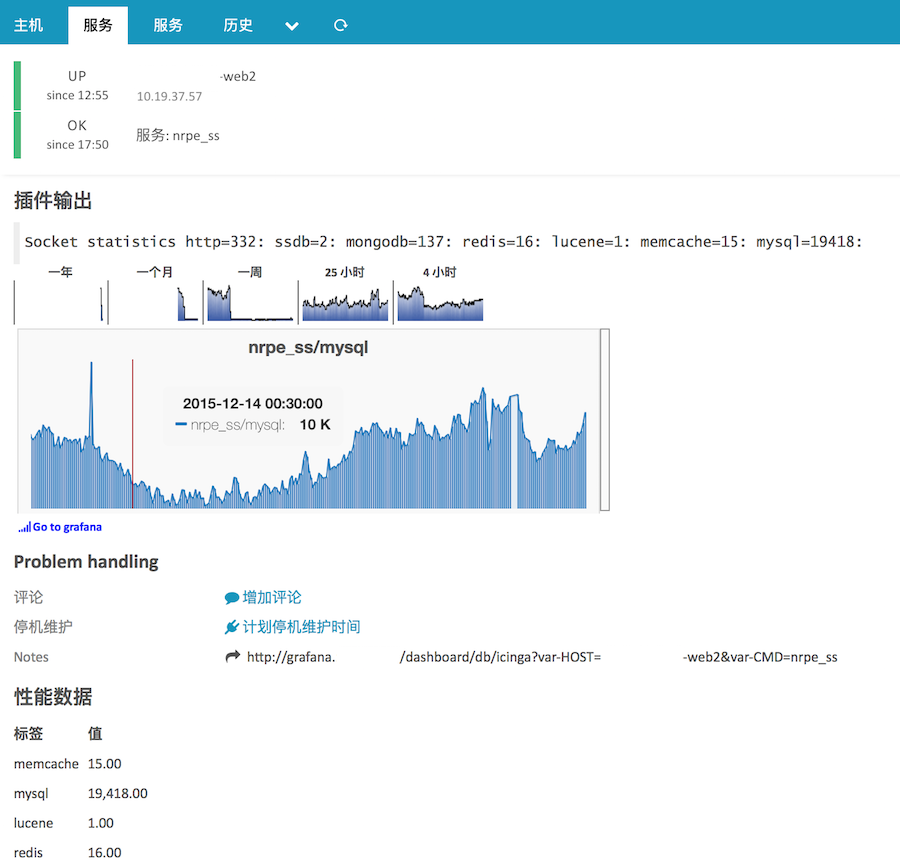
click the notes_url
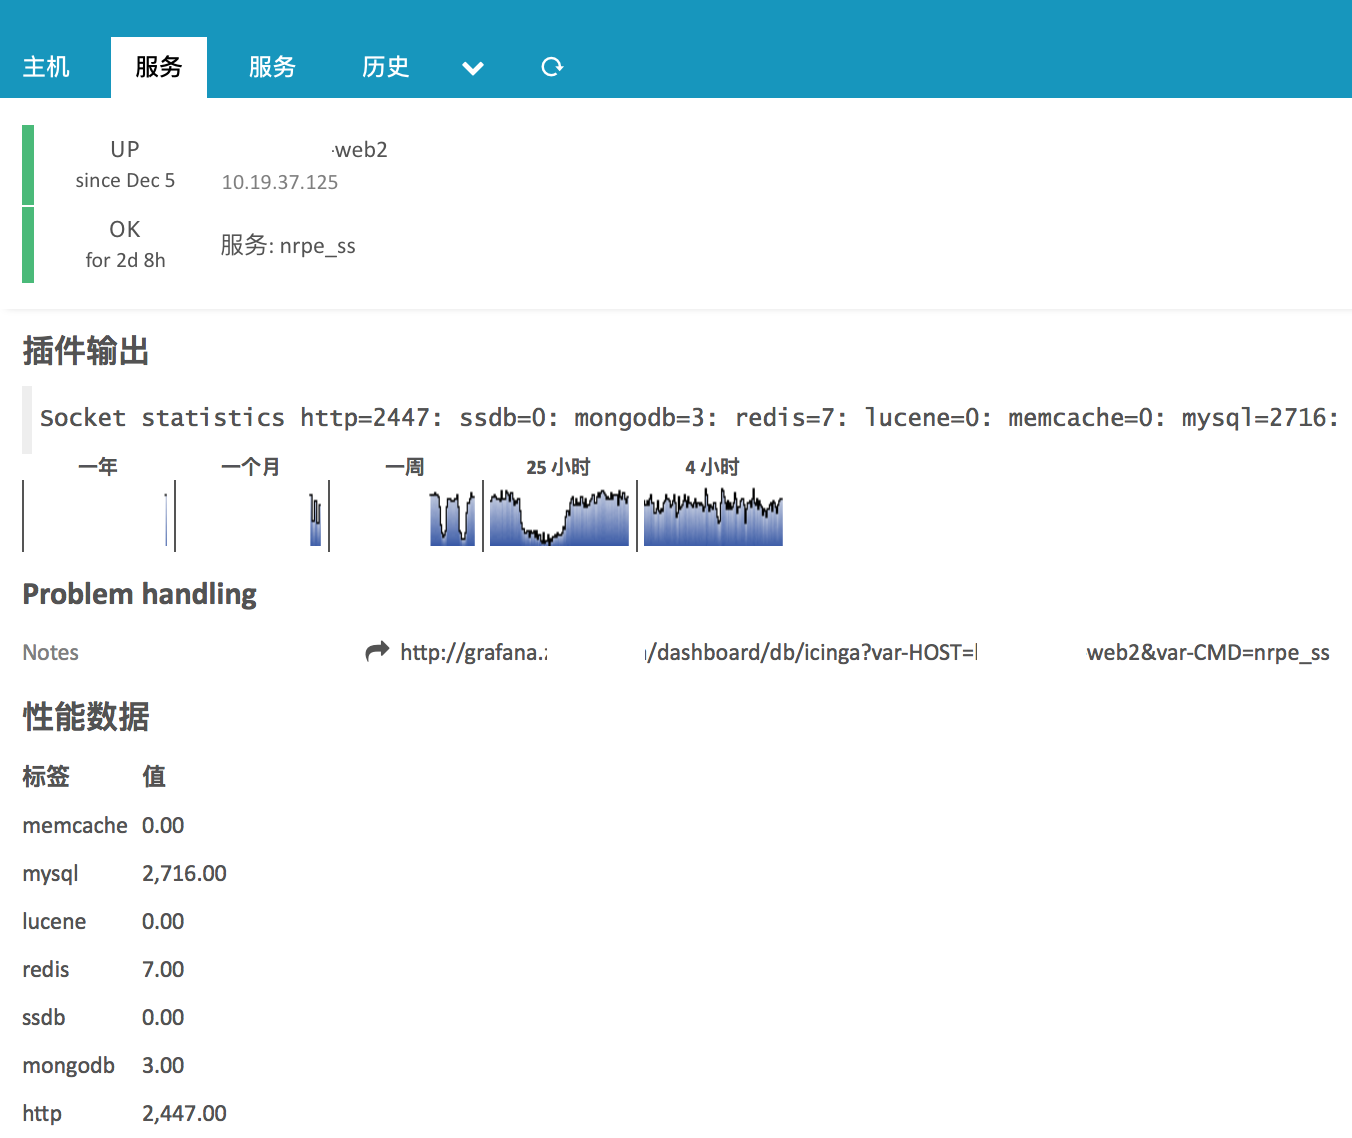
jumped to your grafana dashboard
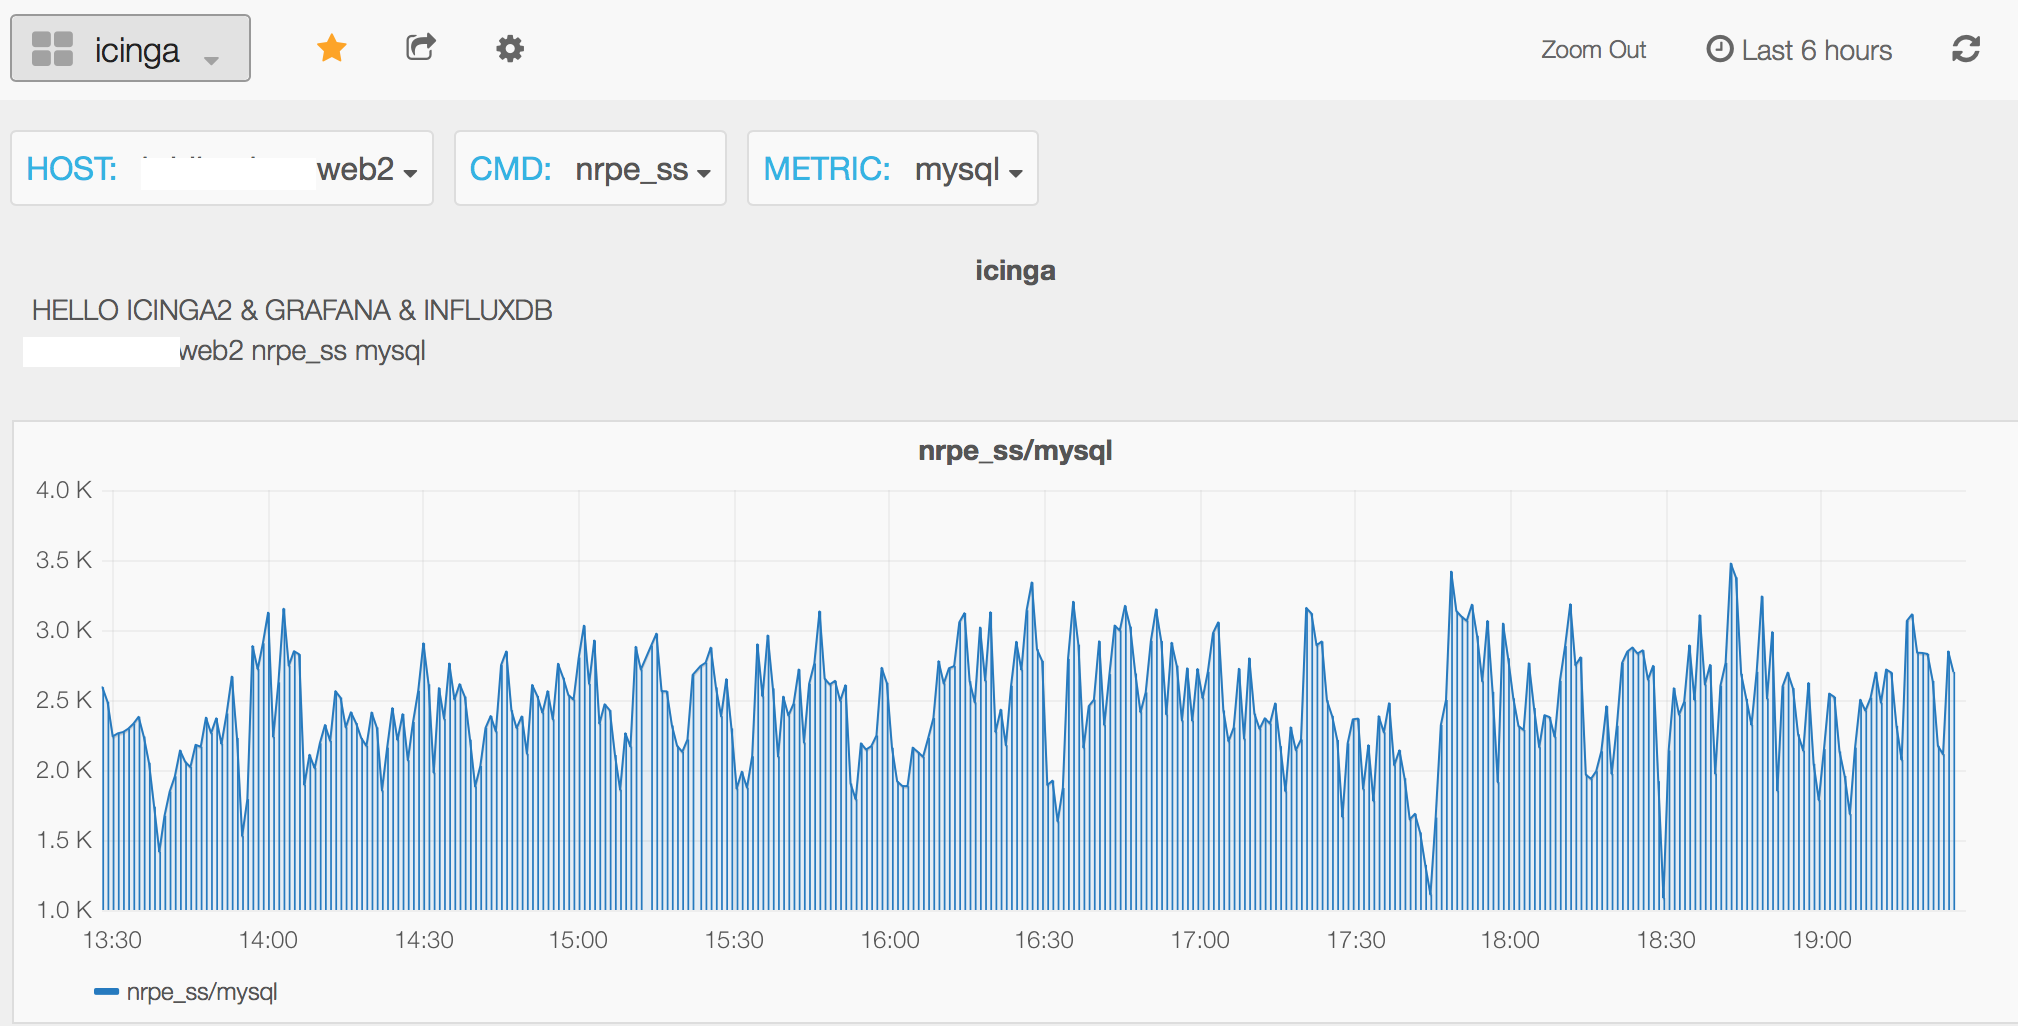
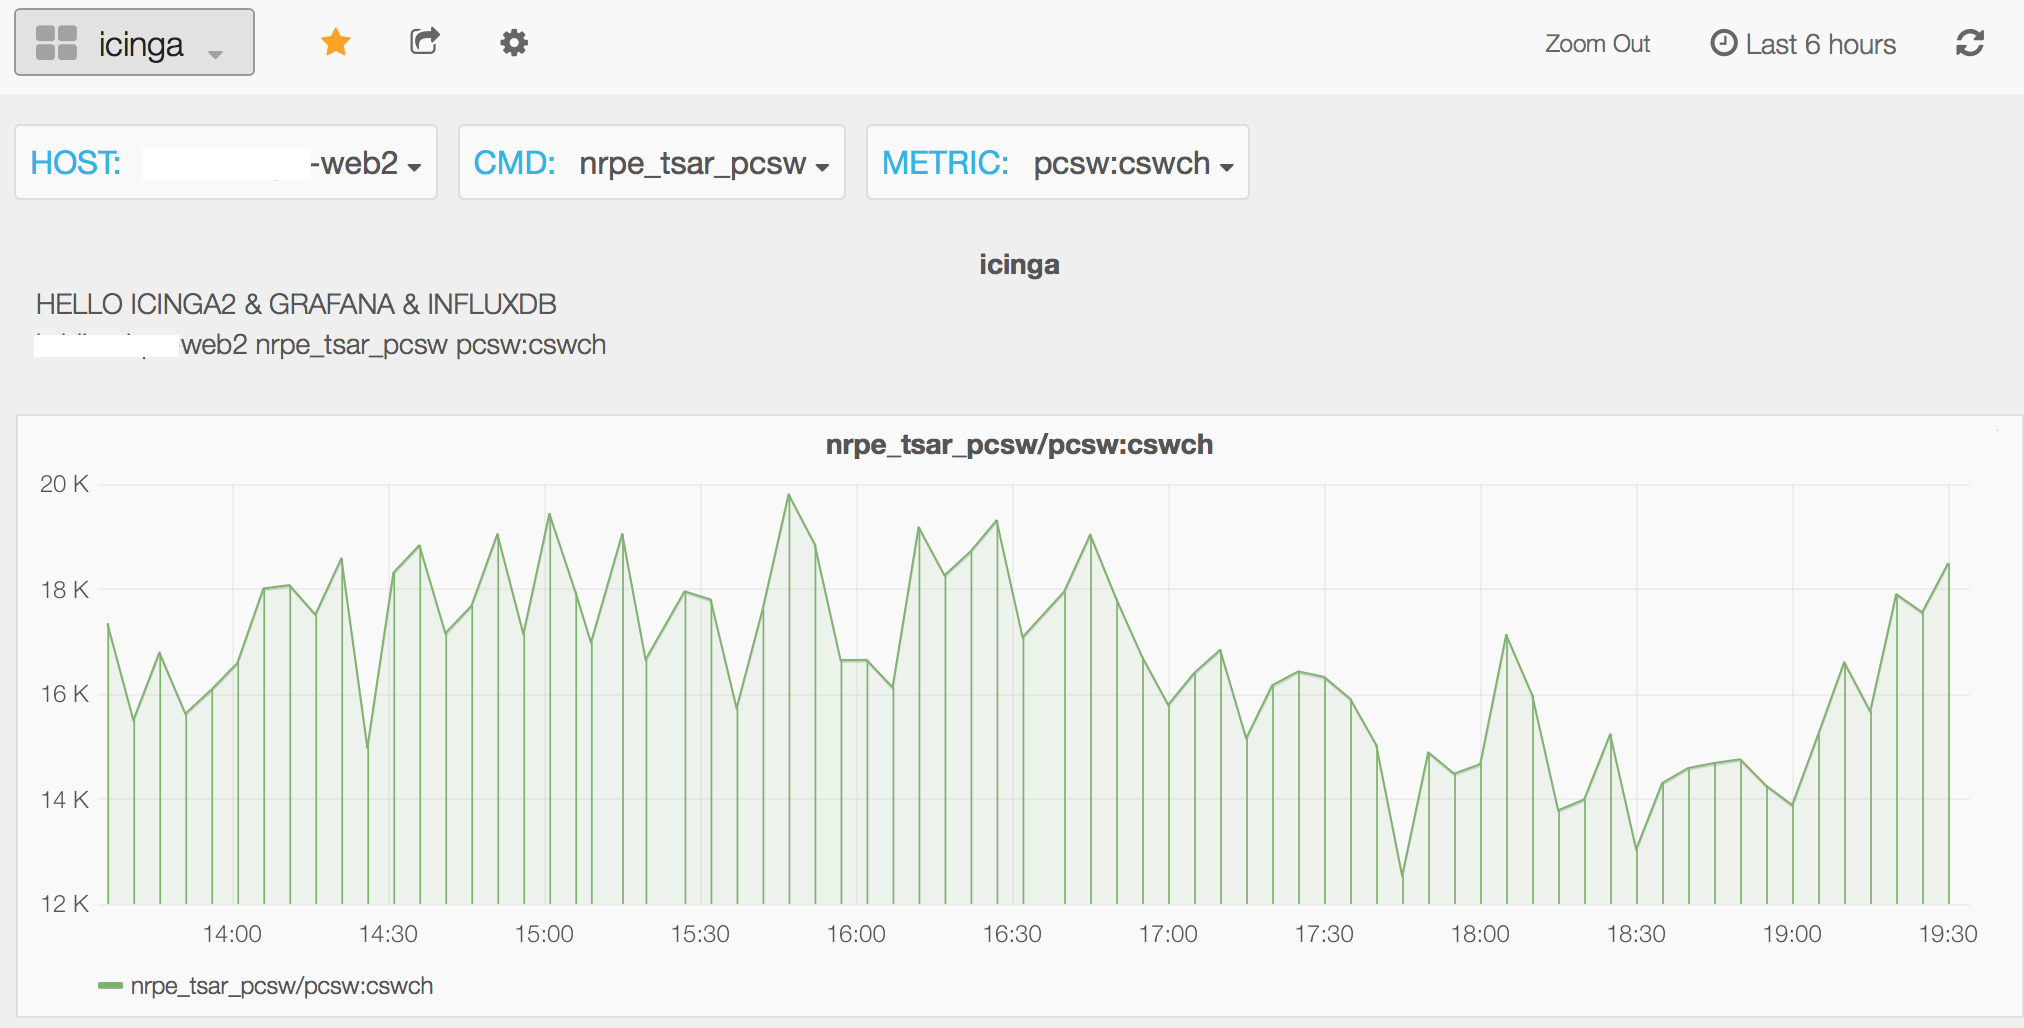
another metric
many useful links
so many grafana examples here
enable influxdb writer
graphite-intro-en
graphite-intro-cn
InfluxDB hook up Graphite as an input source
icinga2-runtime-macros
icinga2-objecttype-graphitewriter
Intruduced Performance Data Pipe of icinga2 in GREAT DETAIL[非常详细的icinga2性能数据管道说明]:
icinga2-performance-data
updated 2016.07.21
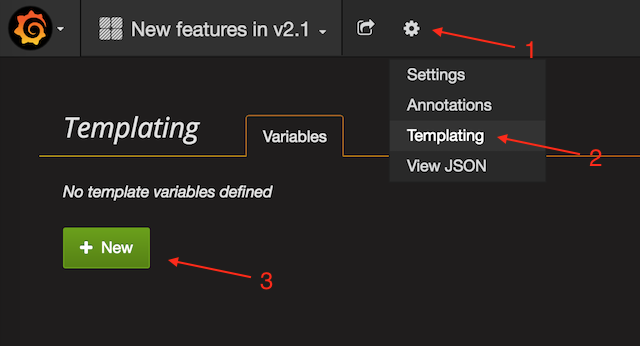
how to create grafana template variables
For this tutorial I’m using Grafana 2.0, I suggest you study on these two dashboards in playground @ grafana.
You can also edit graphs and look at the template settings.
http://play.grafana.org/dashboard/db/monitorama-templating
http://play.grafana.org/dashboard/db/monitorama-templating